Examples: examples/weightedlayout.py
Back to Examples
1 2 3 4 5 6 7 8 9 10 11 12 13 14 15 16 17 18 19 20 21 22 23 24 25 26 27 28 29 30 31 32 33 34 35 36 37 38 39 40 41 42 43 44 45 46 47 | line = Line()
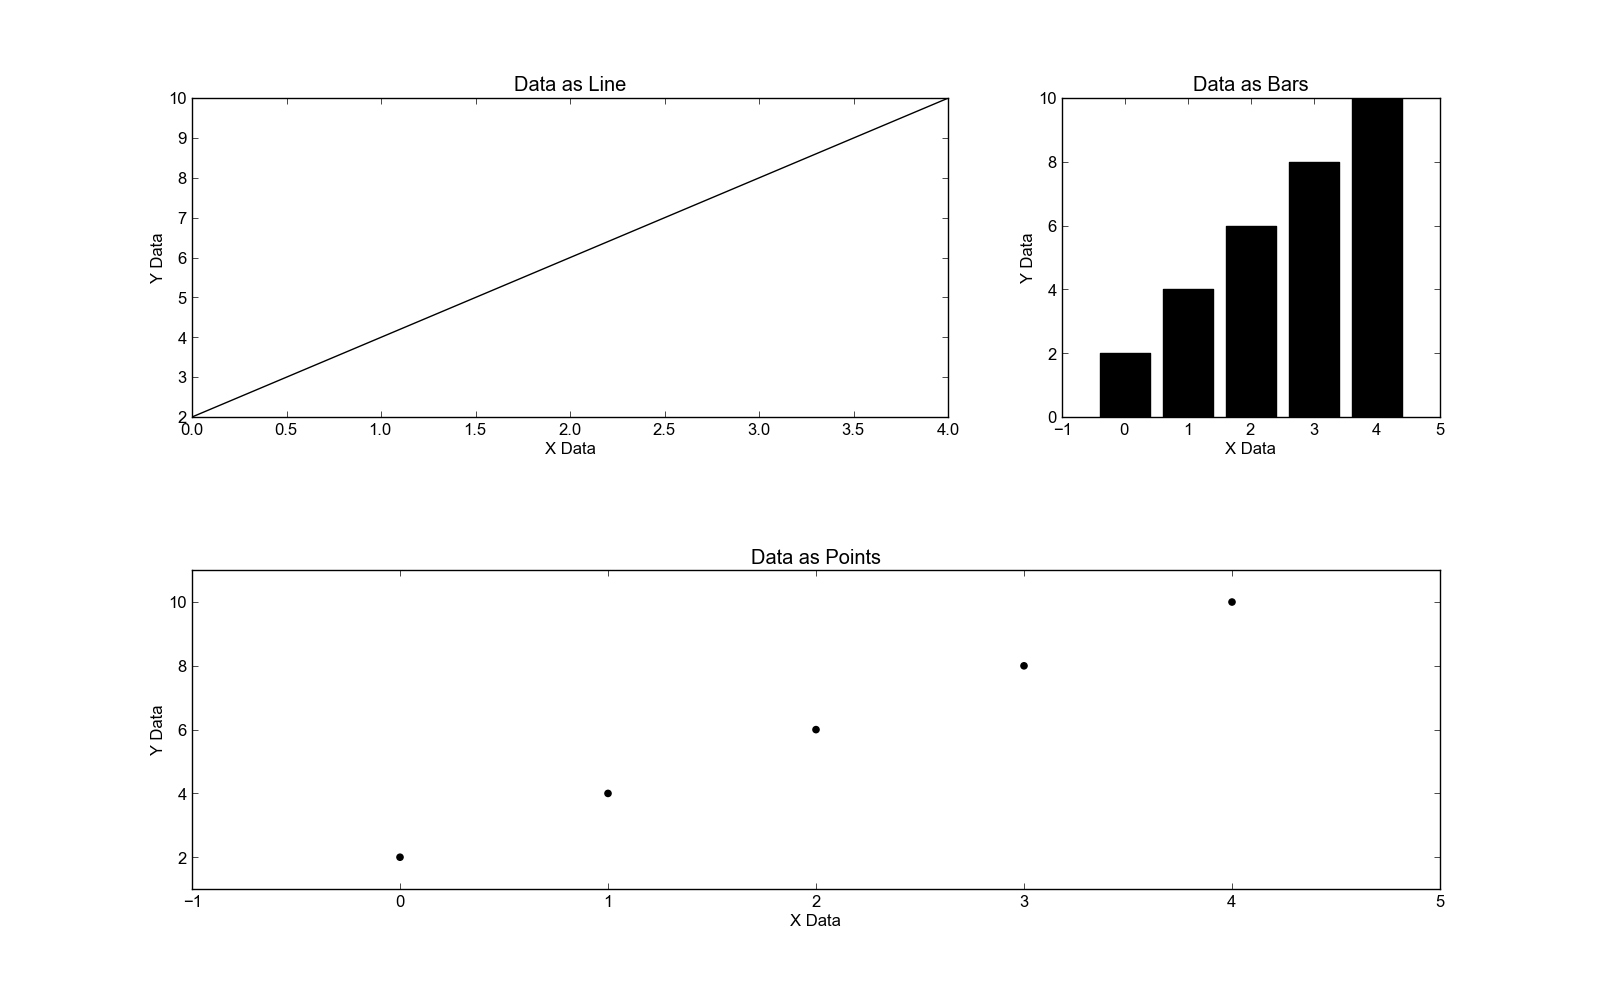
line.xValues = range(5)
line.yValues = [2, 4, 6, 8, 10]
linePlot = Plot()
linePlot.add(line)
linePlot.xLabel = "X Data"
linePlot.yLabel = "Y Data"
linePlot.title = "Data as Line"
bar = Bar()
bar.xValues = range(5)
bar.yValues = [2, 4, 6, 8, 10]
barPlot = Plot()
barPlot.add(bar)
barPlot.xLabel = "X Data"
barPlot.yLabel = "Y Data"
barPlot.title = "Data as Bars"
scatter = Scatter()
scatter.xValues = range(5)
scatter.yValues = [2, 4, 6, 8, 10]
scatterPlot = Plot()
scatterPlot.add(scatter)
scatterPlot.xLabel = "X Data"
scatterPlot.yLabel = "Y Data"
scatterPlot.title = "Data as Points"
layout = WeightedPlotLayout()
# Plots in the same grouping are placed together on the same line
layout.addPlot(linePlot, grouping="topRow", weight=2)
layout.addPlot(barPlot, grouping="topRow")
# Plots without a grouping are arranged as follows:
# * While you can make a row of N plots, where N is the size of the plot
# grouping with the largest size, do so.
# * If you can't make a row of N plots, make the plots stretch across a
# single row.
layout.addPlot(scatterPlot)
layout.save("weightedlayout.png")
|