Examples: examples/stackedlines.py
Back to Examples
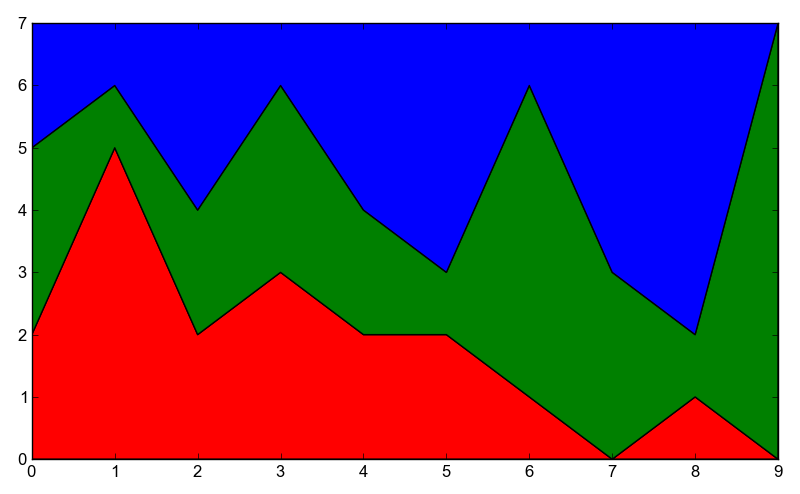
1 2 3 4 5 6 7 8 9 10 11 12 13 14 15 16 17 18 19 20 21 | line1 = Line()
line2 = Line()
line3 = Line()
line1.xValues = range(0,10)
line1.yValues = [2,5,2,3,2,2,1,0,1,0]
line2.xValues = range(0,10)
line2.yValues = [3,1,2,3,2,1,5,3,1,7]
line3.xValues = range(0,10)
line3.yValues = [2,1,3,1,3,4,1,4,5,0]
stack = StackedLines()
stack.addLine(line1, "red")
stack.addLine(line2, "green")
stack.addLine(line3, "blue")
plot = Plot()
plot.setXLimits = (0, 9)
plot.setYLimits = (0, 7)
plot.add(stack)
plot.save("stackedlines.png")
|