Examples: examples/split.py
Back to Examples
1 2 3 4 5 6 7 8 9 10 11 12 13 14 15 16 17 18 19 20 21 22 | import numpy
line = Line()
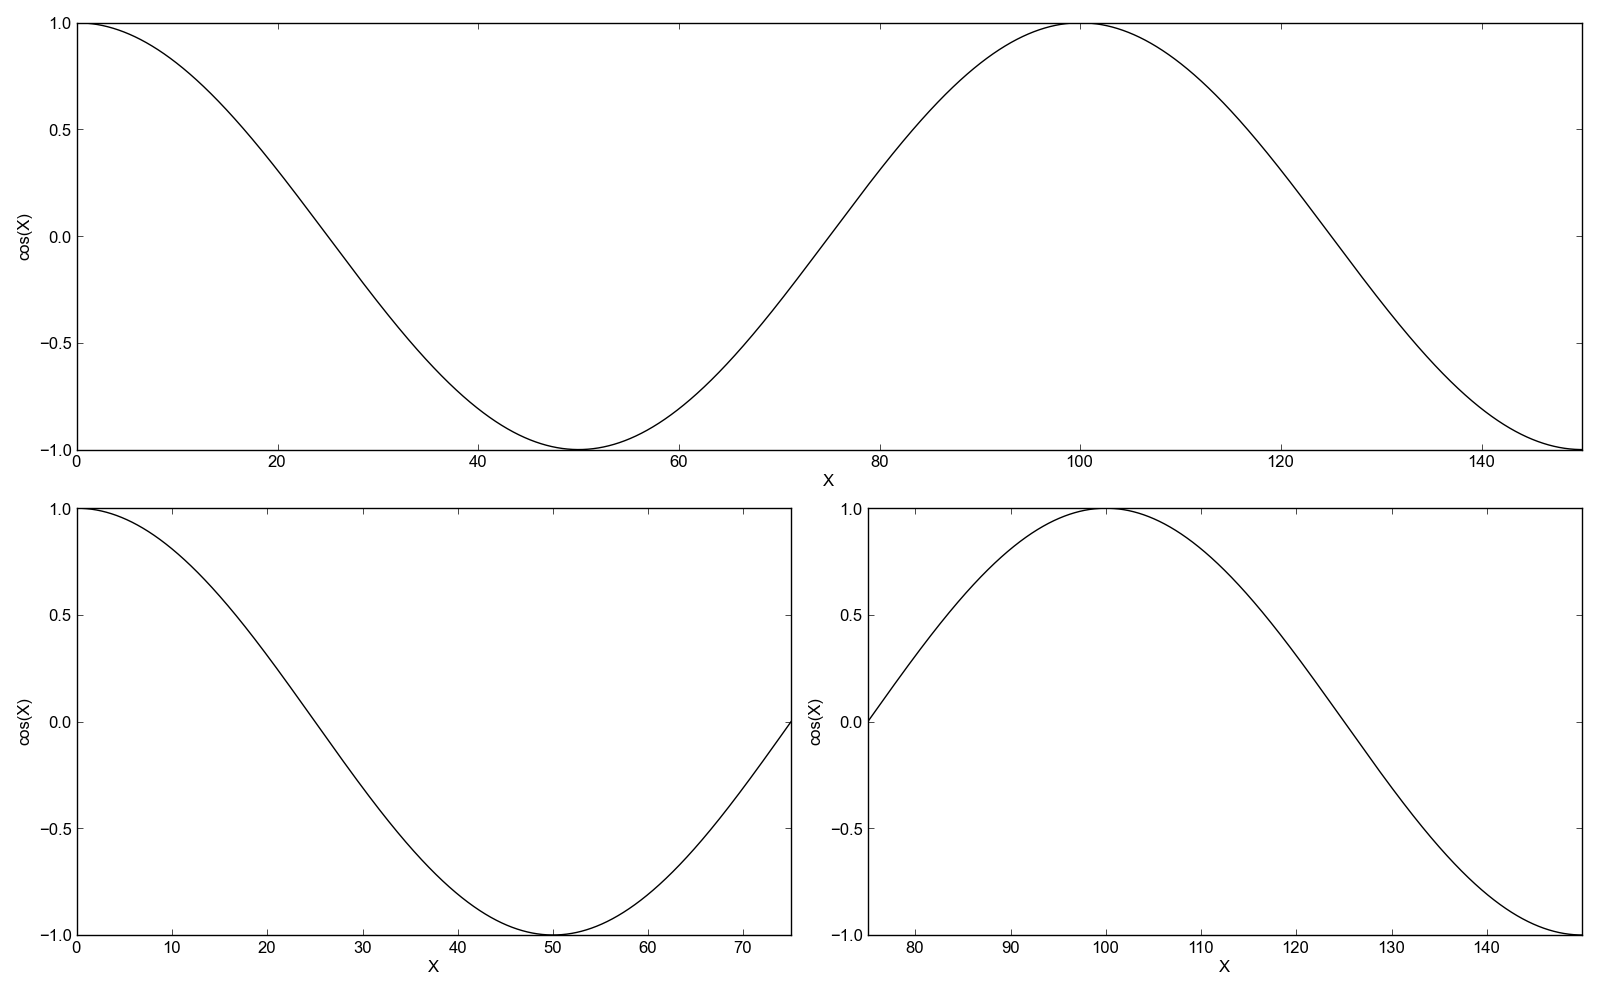
line.xValues = numpy.arange(0, 150, 0.01)
line.yValues = numpy.cos(.02 * numpy.pi * line.xValues)
plot = Plot()
plot.add(line)
plot.xLimits = (0, 150)
plot.yLimits = (-1, 1)
plot.xLabel = "X"
plot.yLabel = "cos(X)"
splitPlots = plot.split(2)
layout = PlotLayout()
layout.width = 2
layout.addPlot(plot, grouping="unsplit")
for s in splitPlots:
layout.addPlot(s, grouping="splits")
layout.save("split.png")
|