Examples: examples/errorbars.py
Back to Examples
1 2 3 4 5 6 7 8 9 10 11 12 13 14 15 16 17 18 19 20 21 22 23 24 25 26 27 | plot = Plot()
# Uneven error bars
line = Line()
line.xValues = range(6)
line.yValues = [25, 21, 30, 23, 10, 30]
line.yMins = [10, 18, 10, 10, 5, 20]
line.yMaxes = [30, 50, 40, 30, 20, 45]
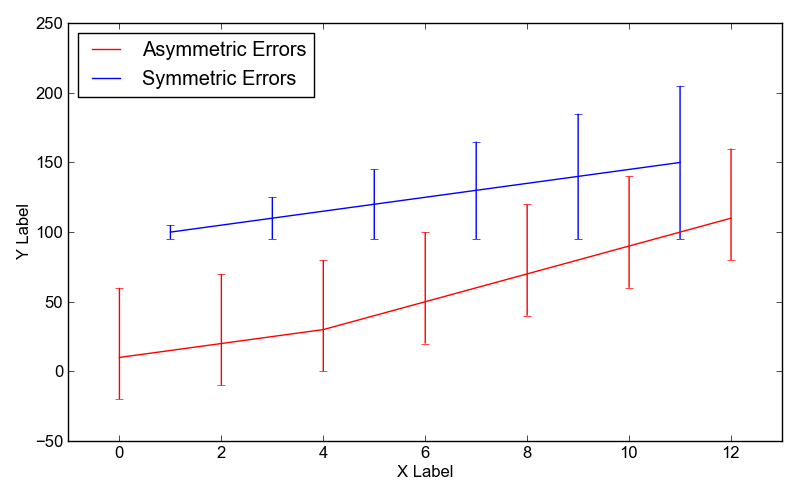
line.label = "Asymmetric Errors"
line.color = "red"
line.xValues = range(len(line.yValues))
# Even error bars
line2 = Line()
line2.xValues = range(6)
line2.yValues = [35, 40, 45, 40, 55, 50]
line2.color = "blue"
line2.label = "Symmetric Errors"
line2.yErrors = [3, 6, 5, 3, 5, 4]
plot.add(line)
plot.add(line2)
plot.xLabel = "X Label"
plot.yLabel = "Y Label"
plot.hasLegend()
plot.save("errorbars.png")
|