Examples: examples/clusteredstackedbars.py
Back to Examples
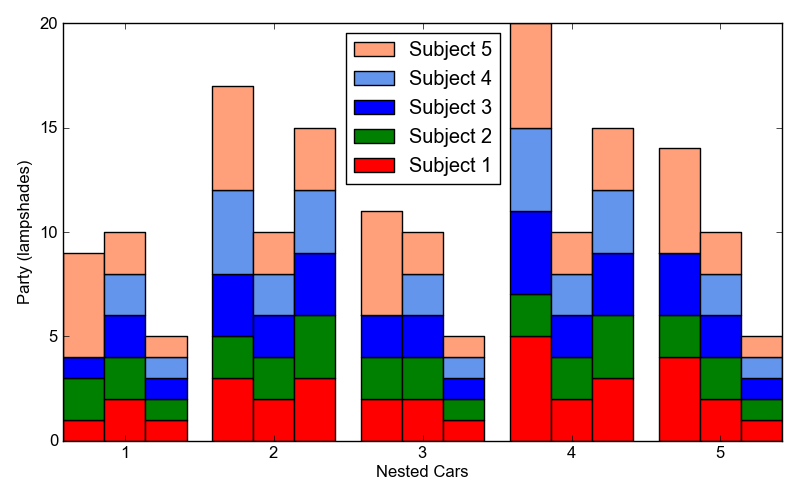
1 2 3 4 5 6 7 8 9 10 11 12 13 14 15 16 17 18 19 20 21 22 23 24 25 26 27 28 29 30 31 32 33 34 35 36 37 38 39 40 41 42 43 44 45 46 47 48 49 50 | cluster = ClusteredBars()
colors = ['red','green','blue','CornflowerBlue','LightSalmon']
yVals = [
[
[1, 3, 2, 5, 4],
[2, 2, 2, 2, 2],
[1, 3, 2, 4, 3],
[0, 4, 0, 4, 0],
[5, 5, 5, 5, 5]
],
[
[2, 2, 2, 2, 2],
[2, 2, 2, 2, 2],
[2, 2, 2, 2, 2],
[2, 2, 2, 2, 2],
[2, 2, 2, 2, 2]
],
[
[1, 3, 1, 3, 1],
[1, 3, 1, 3, 1],
[1, 3, 1, 3, 1],
[1, 3, 1, 3, 1],
[1, 3, 1, 3, 1],
]
]
for i in xrange(3):
stack = StackedBars()
for j in xrange(5):
bar = Bar()
bar.xValues = range(5)
bar.yValues = yVals[i][j]
bar.color = colors[j]
bar.label = "Subject %d" % (j+1,)
stack.add(bar)
cluster.add(stack)
cluster.spacing = 0.5
cluster.xTickLabels = ["1", "2", "3", "4", "5"]
plot = Plot()
plot.add(cluster)
plot.hasLegend()
plot.xLabel = 'Nested Cars'
plot.yLabel = 'Party (lampshades)'
plot.save("clusteredstackedbars.png")
|